
Clicking on an incident from the main Microsoft 365 DefenderIncidents page leads to the Attack story view of an incident. In this view, you have the flexibility to pivot on various elements, including individual alerts in the Alerts pane, items displayed in the Incident graph, or any of other the available tabs that are part of the incident (Alerts, Assets, Investigations, Evidence and Response, and Summary).
The Incident graph section in the Attack story tab automatically groups similar items and nodes together, although you can toggle this feature off to view each item node separately. The graph can be useful for gaining a clearer understanding of interactions between events, as shown in Figure 7.13:
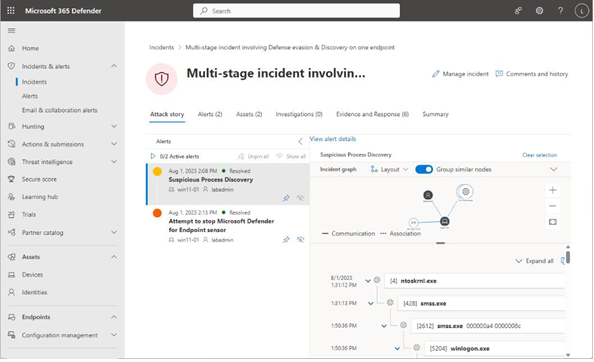
Figure 7.13 – Reviewing the Incident graph as part of an Attack story
Each item within this context provides relevant details and actionable options. For instance, you can access URL details that a malicious process attempted to contact or examine the code executed within a script. Clicking on an item in the Alerts pane of the Attack story refocuses the details pane on that specific item within the Incident graph and displays related events in the chain. For instance, clicking on the Attempt to stop Microsoft Defender for Endpoint sensoralert item (Figure 7.14) causes the Attack story to pivot, highlighting the processes and devices in the Incident graph:
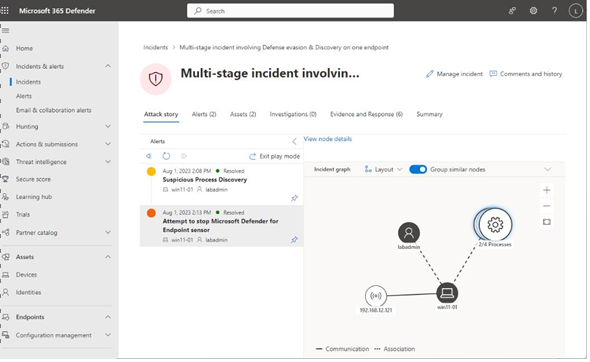
Figure 7.14 – Reviewing an alert in the Attack story
Clicking on the individual nodes in the Incident graph presents additional details, such as the IP address, commands executed, or processes started and stopped.
Alerts
Switching to the Alerts tab within an incident displays all associated alerts. Individual alerts can be selected to access more information, including details related to files, IP addresses, devices, or processes, depending on the alert type. Users have the option to modify the Classification of the alert state (setting it to New, In progress, or Resolved), assign it to an individual for further investigation or triage, specify a classification, and add comments (as depicted in Figure 7.15):
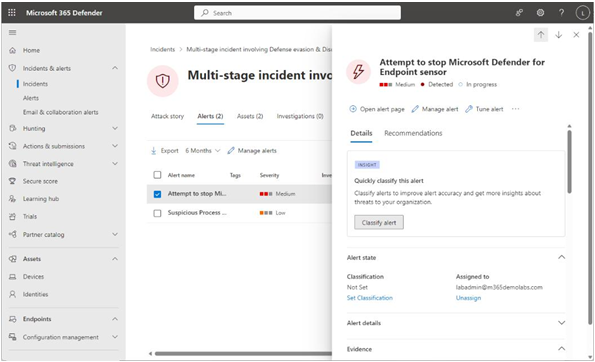
Figure 7.15 – Reviewing an alert’s details
The classification feature aids in distinguishing genuine risks. This classification informs others in the organization about how to appropriately respond to such alerts.
Assets
The Assets tab within an incident provides a comprehensive view of all organizational assets impacted by the incident. These assets encompass Devices, Users, Mailboxes, and Apps. When a specific asset category is chosen, it reveals all the affected items within that category that are linked to the ongoing incident. Furthermore, selecting an individual item within this list will navigate you to the corresponding asset page, such as the Assets page for devices and users or the Threat Explorer for mailboxes.
Investigations
The Investigations tab is used to track an incident’s triggering alerts. After selecting an alert to view its details, you can click Open investigation page to explore the event. This area also shows any automated actions that Defender has taken on your organization’s behalf. An investigation is shown in Figure 7.16:
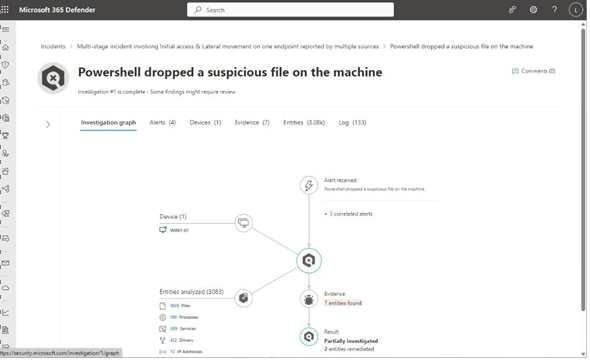
Figure 7.16 – Reviewing an investigation
The Investigation graph tab can show many details, depending on the type of alert being reviewed. Typically, an investigation will center around activities on a device or identity, with connectors branching out to items correlated from the graph (such as a script that creates a file or items currently loaded in memory on the device).
Leave a Reply